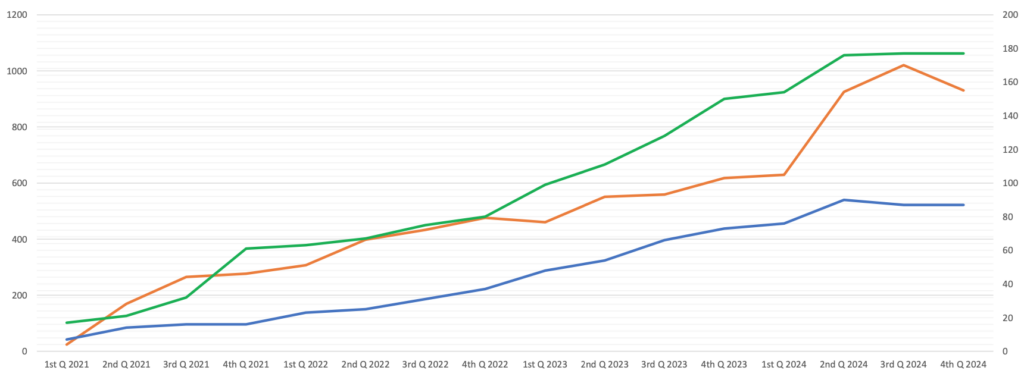
This chart represents select performance figures tracked by the South Coastal Village Volunteers. Each line depicts the steady growth of a measurement by quarter since SCVV’s inception at the beginning of 2021.
The green line represents the number of volunteers: more than 170.
The orange line represents the number of requests filled by our volunteers during a quarter: 930 at the end of 2024 (see graph numbers at left).
The blue line represents the number of service-eligible SCVV members: 87 at the end of 2024.